

As you can probably tell, I’m working on some Power BI reports from Business Central (check out the learning paths page for some related posts). This post, though, doesn’t have a ton to do with the data structure in Business Central, so it should apply to most accounting systems where you want to build some financial statements.
The thing about financial statements is that the structure and layout of them is very important. Even though you can get the numbers right, all these accounting folks get bent out of shape when the metrics aren’t in the right place.
What does the data look like
So, about the data structure. I have fact table and some dimension tables. My fact table is built up by appending two tables together – my actuals and my budgets. The below screenshot is a simple approximation of what the fact table looks like.


Here’s what the account dimension table looks like.


You can probably assume there’s a pretty simple relationship here between the account number in the fact table and the dimension table.
Looking at an income statement, you’ll a lot of times the report organized by revenue, costs of goods or services, expenses, and then a bunch of calculations like gross margin, net income, and EBITDA. There’s a couple of different ways to calculate these measures, and I’ll show you what I tried and where I landed.
Using calculated measures to build a total revenue number
Initially, I didn’t have budget numbers in my fact table, so I didn’t have to worry about the Type. The first thought I had was to create a list of calculated measures for Revenue, COGS, gross margin, and all the balance sheet calculations, so I did that.
Income = -1 * CALCULATE(SUM('GL entries'[Amount]), 'Financial Statement Structure'[Category] = "Income"Super easy, right? I made a bunch of these measures, tossed them in a calculated table for organization purposes, and then moved on. Unfortunately, things got more complicated when I added in the budget numbers. With the above approach, I would have needed to duplicate the these measures for both actuals and budget and the also create a copy of each of them for variances. Seemed really messy and I thought there needed to be a better. What to do, what to do…
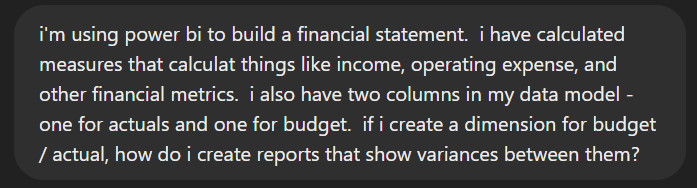
Asking ChatGPT for a better approach
I explained what I was doing to Chat GPT.

It gave me an approach, but I clarified and wanted a different approach.

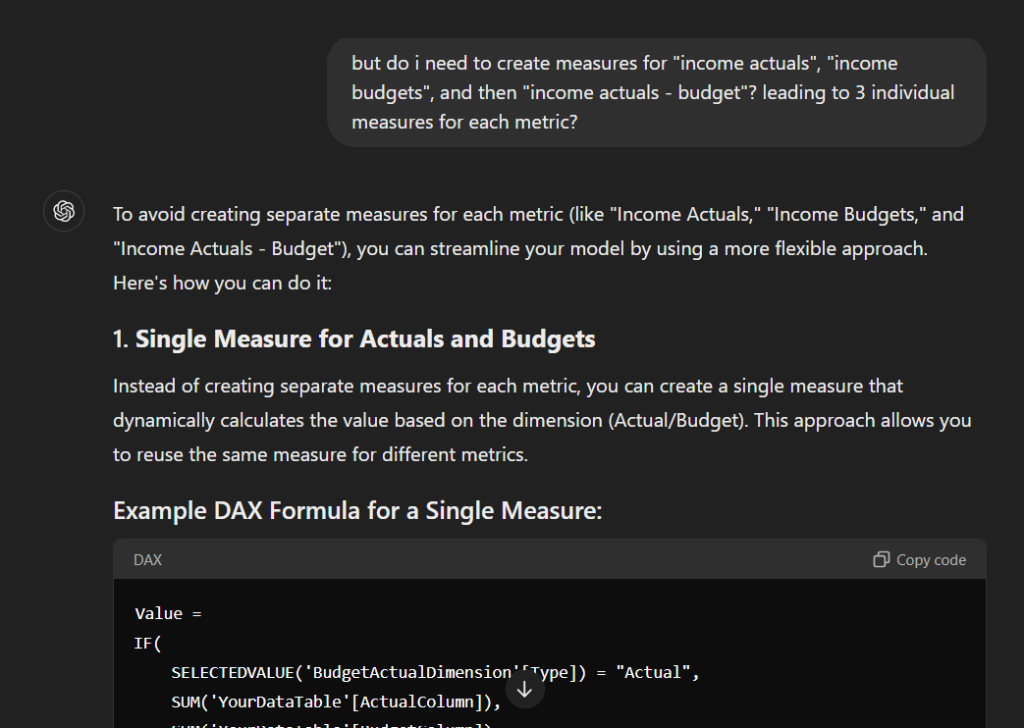
After a couple more iterations, I got to what I was looking for. Basically, there’s a few steps:
- Create a manual table that has the list of measures entered in it (you’ll key these in and eventually use this table sort of as a dimension you’ll include in your visuals)
- On that calculated table, create a “Value” measure that has a gigantic SWITCH statement in it that looks at some selected values from the Type column on your fact table and the measures selected from Step 1 above.
- Create a measure for “Actual” and “Budget” that pass in the type you want into the Value measure.
I hadn’t really considered that and wasn’t sure how it was going to work, but once I put it together it made sense.
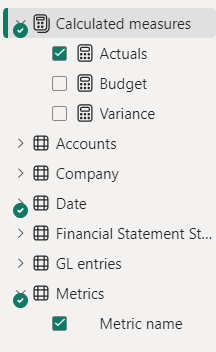
Step 1 – Create the manual table
Like I said, I created a manual table with three columns.

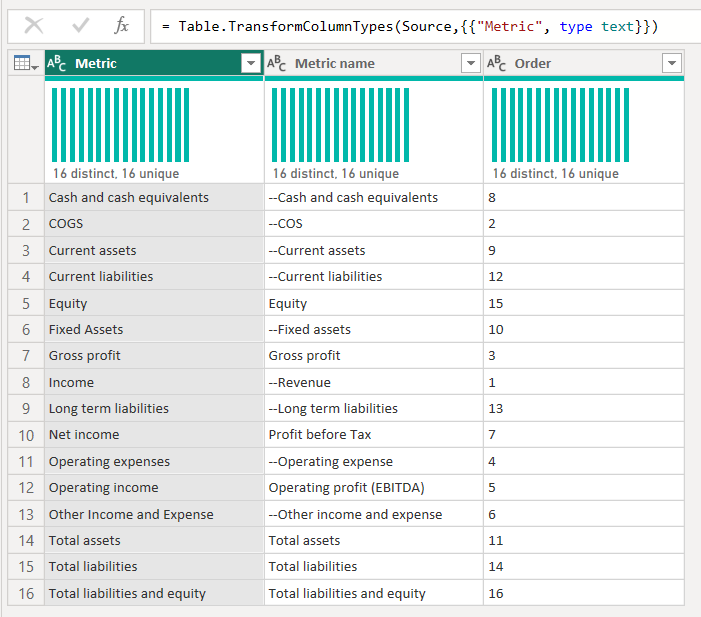
The “metric” column is what I’ll be using for my calculations, the “metric name” column has some dashes in it to indent certain rows in the financial statements, and then the “order” column is used for ordering the metrics in the position I want them.
Step 2 – Create the “Value” measure.
The value measure is going to with the “Actual” and “Budget” measures we’ll create in the next step, but we’ll get to that in due time.
VALUE =
SWITCH(
    TRUE(),
…
    SELECTEDVALUE('METRICS'[METRIC]) = "INCOME" && SELECTEDVALUE('GL ENTRIES'[TYPE]) = "ACTUAL", -1 * CALCULATE(SUM('GL ENTRIES'[AMOUNT]), 'FINANCIAL STATEMENT STRUCTURE'[CATEGORY] = "INCOME", 'GL ENTRIES'[TYPE]="ACTUAL"),
    SELECTEDVALUE('METRICS'[METRIC]) = "INCOME" && SELECTEDVALUE('GL ENTRIES'[TYPE]) = "BUDGET", CALCULATE(SUM('GL ENTRIES'[AMOUNT]), 'FINANCIAL STATEMENT STRUCTURE'[CATEGORY] = "INCOME", 'GL ENTRIES'[TYPE]="BUDGET"),

    SELECTEDVALUE('METRICS'[METRIC]) = "LONG TERM LIABILITIES" && SELECTEDVALUE('GL ENTRIES'[TYPE]) = "ACTUAL", CALCULATE(SUM('GL ENTRIES'[AMOUNT]), ACCOUNTS[SUBCATEGORY] = "LONG TERM LIABILITIES", 'GL ENTRIES'[TYPE] = "ACTUAL"),
    SELECTEDVALUE('METRICS'[METRIC]) = "LONG TERM LIABILITIES" && SELECTEDVALUE('GL ENTRIES'[TYPE]) = "BUDGET", CALCULATE(SUM('GL ENTRIES'[AMOUNT]), ACCOUNTS[SUBCATEGORY] = "LONG TERM LIABILITIES", 'GL ENTRIES'[TYPE] = "BUDGET"),
…
    BLANK()
)
As you can see above, this “Value” measure returns different results based on inputs from other dimensions. Each statement checks to look what metric is being asked for and it it’s actuals or budget values that are needed. Once both conditions of any statement are met, the appropriate calculation result is returned.
You’ll need to create a switch block for each of the combinations of actuals / budgets and each metric you’ve entered in the manual table.
The “BLANK()” at the end is the default case if no other matches are found.
Step 3 – Create the actual, budget, and variance measures
These measures are going to be the values in each of the visualization we want to display. This step is pretty easy – create a calculated measure called “Actual” and set it to:
Actuals = CALCULATE([VALUE], 'GL entries'[Type] = "Actual")Do the same for budget and then create a “variance” measure that subtracts the budget measure from the actual measure.
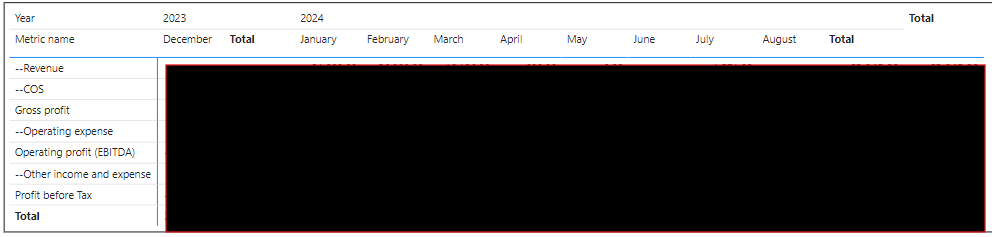
Step 4 – Put it to use
Now that you have the measures and dimensions setup, put them in a visualization. I think this works particularly well in a matrix visualization, as it allows you to put the “Metric name” dimension value on the left axis and something like the Month or Year–>Month hierarchy on the X axis. For this to display values, you’ll select the “Actual” or “Budget” measure to be the values.

Conclusion
There’s still a lot of manual typing required to build this whole thing out. Also, it’s kind of a pain – if you want to change how your Income metric is calculated, you’ll need to make sure you go and change the other metrics that use income as an input, but I like keeping this complexity behind the scenes and not in my measure list.

Hope this helps!
Leave a Reply Cancel reply